Calculating median scores
The following example uses the Crocodile Rock Cafe Survey. Question 6a is an attitude questions using a rating scale of very good to very poor coded 1 to 5.
-
Click
 to display the Analysis Definition dialog box.
- Specify the Analysis as Q6e, Choice of food.
- Specify the Break as Q11, Age range.
- Click on the Summary Statistics tab.
- Highlight Median from the ‘Available’ list and click > to add it to the Used column. You can position the Median scores above the body of the table by using the Move Up button.
- Click OK to display the table.
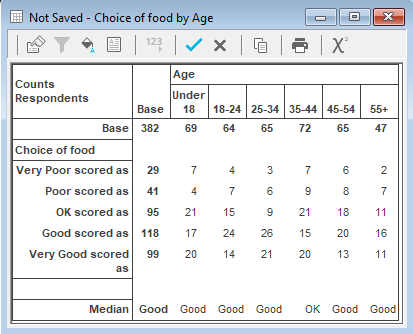
Remember that calculating the median means finding the mid-point. In this example 65 respondents are 25-34; therefore the mid-point is 32. The 32nd respondent in that age group responded ‘Good’ so the median is ‘Good’. 72 respondents are 35-44 and the mid-point is 36. The 36th respondent comes within the responses of ‘OK’ and the median is therefore ‘OK’.
You can add a score to the table by checking the Scored box. The median will be calculated using the score displayed.