
Access our helpful new worksheet to learn about how you can summarize rating scale responses with Group Variables
It’s a breeze to make comparisons between question grids in your survey when you add an ‘Overall’ category to charts of rating scale responses.
The steps in the worksheet include:
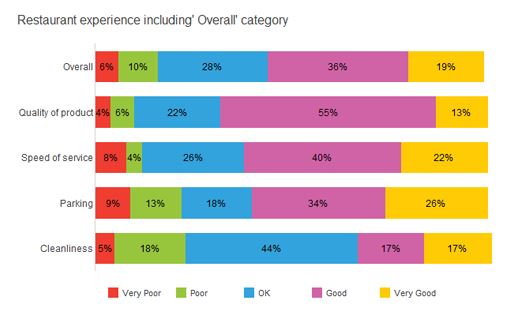
- Build a horizontal bar chart of rating scale responses
- Create an ‘Overall’ Group Variable to combine responses from all questions
- Add the ‘Overall’ category to the Horizontal bar chart
In this worksheet, you’ll also find out what else you can do with Group Variables.
Find out more about Group Variables in the new Snap Support Hub.